
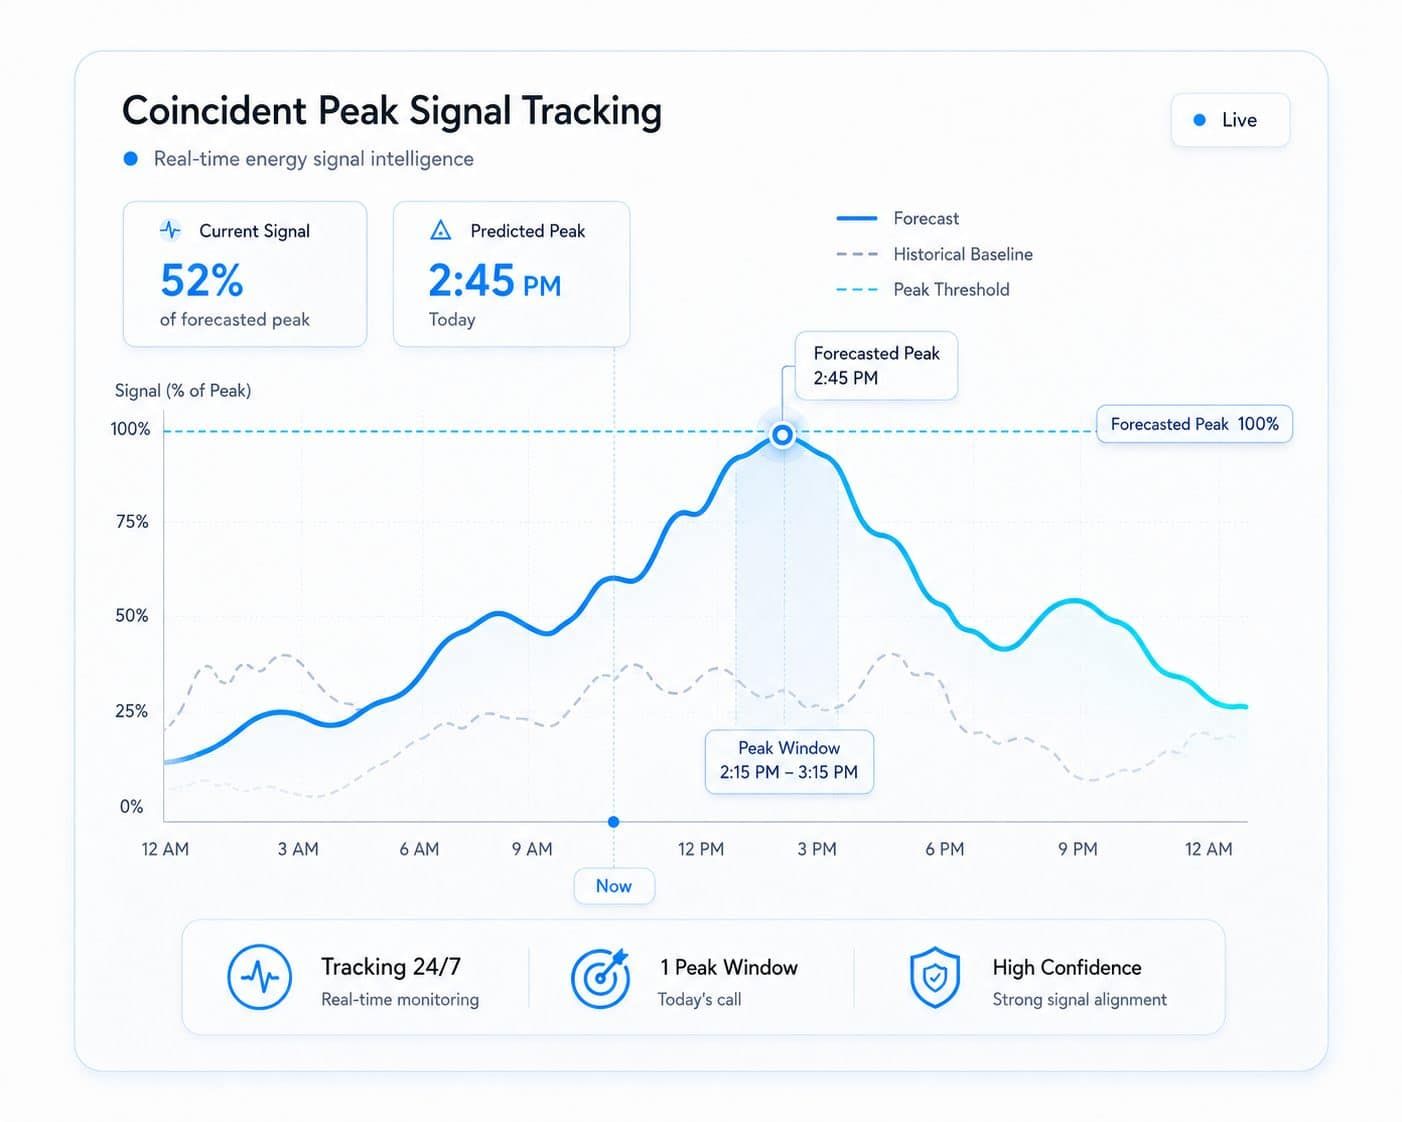
In ISO-NE and PJM, a single hour of bad load can determine your capacity bill for the next twelve months. The math is brutal: utilities allocate fixed transmission and capacity costs based on your facility's contribution during system-wide peaks. Miss the hour, and a year's worth of demand-response work is wiped out.
The traditional response has been reactive — react to alerts, call building engineers, shed load when meters spike. SiteIQ takes a different approach: forecast the peak hour 24 hours in advance with sufficient confidence to schedule curtailment automatically.
Why 24 hours matters
Most peak alerting services issue notifications the morning of, or even hours before, the projected peak. That window forces facility teams to make rushed decisions — pre-cooling that wastes energy, blanket setpoint shifts that hurt occupant comfort, and curtailment that gets called off when the peak doesn't materialize.
A 24-hour horizon changes the operating model. Building automation systems can ramp pre-cooling during off-peak hours, thermal storage can be charged at favorable rates, and on-site generation can be scheduled into the optimal window without operator intervention.
"We're not predicting weather. We're predicting how 50 million HVAC systems will respond to weather — that's a fundamentally different problem."
Inside the forecasting stack
The model ensemble fuses six categories of input data, each updated on its own cadence:
- Weather ensemblesGFS, ECMWF, and HRRR runs blended with sub-hourly mesonet observations across each ISO footprint.
- ISO load historyFive years of system-wide load curves at 5-minute resolution, normalized for population growth and behind-the-meter solar.
- Behavioral signalsHoliday calendars, school schedules, large event detection, and sector-specific occupancy patterns.
- Generation mixReal-time fuel mix, scheduled outages, and transmission constraints affecting marginal cost.
- Regional sensorsSiteIQ's own building telemetry across 1,200+ facilities providing leading indicators for HVAC ramp behavior.
- Historical settlementsFive years of confirmed coincident peak hours with full attribution back to weather and behavioral conditions.
Confidence-aware scheduling
A forecast without a confidence interval is a guess. Every hourly prediction emits a probability distribution, and the orchestration layer only triggers curtailment when the joint probability of being the daily peak crosses a facility-specific threshold. For most customers, that threshold sits between 70% and 85% — high enough to avoid false alarms, low enough to capture every settlement event.
What this means for your facility
If you're a facility VP in PJM or ISO-NE, the practical impact is straightforward: you stop paying for peak hours you didn't help create. Capacity charges drop, transmission allocations shrink, and your demand-response strategy stops being a fire drill.
The intelligence layer does the work — your team focuses on the buildings.